Technical Indicators Every Crypto Trader Should Know
- Understanding Moving Averages
- Introduction to Relative Strength Index (RSI)
- Exploring Bollinger Bands
- The Importance of MACD in Crypto Trading
- Using Fibonacci Retracement Levels
- Mastering the Stochastic Oscillator
Understanding Moving Averages
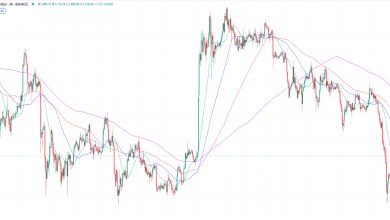
Moving averages are a key technical indicator that every crypto trader should be familiar with. They help smooth out price data to identify trends over a specific period of time. By calculating the average price of an asset over a set number of periods, moving averages can provide valuable insights into the direction of the market.
There are two main types of moving averages that traders commonly use: the simple moving average (SMA) and the exponential moving average (EMA). The SMA gives equal weight to each data point in the calculation, while the EMA places more emphasis on recent prices. Both types of moving averages have their own strengths and weaknesses, so it’s important to understand how they work and when to use them.
One of the most common strategies involving moving averages is the crossover method. This involves looking for instances where a short-term moving average crosses above or below a longer-term moving average. A bullish crossover, where the short-term average crosses above the long-term average, is seen as a buy signal. Conversely, a bearish crossover, where the short-term average crosses below the long-term average, is considered a sell signal.
Traders can also use moving averages to identify support and resistance levels. When an asset’s price is above its moving average, the average can act as a support level. Conversely, when the price is below the moving average, it can act as a resistance level. By paying attention to these levels, traders can make more informed decisions about when to enter or exit a trade.
In conclusion, moving averages are a versatile tool that can help crypto traders analyze market trends and make better trading decisions. By understanding how moving averages work and incorporating them into their trading strategies, traders can gain a competitive edge in the volatile world of cryptocurrency trading.
Introduction to Relative Strength Index (RSI)
The Relative Strength Index (RSI) is a popular **technical indicator** used by **crypto traders** to determine whether an asset is **overbought** or **oversold**. It measures the speed and change of price movements, providing insights into **market conditions**.
**RSI** is calculated using the average gains and losses over a specified period, typically 14 days. The formula for **RSI** involves comparing the average gain to the average loss, resulting in a value between 0 and 100. A reading above 70 indicates that an asset may be **overbought**, while a reading below 30 suggests it may be **oversold**.
**Traders** use **RSI** to identify potential **buy** or **sell** signals. When **RSI** crosses above 70, it may be a signal to **sell**, as the asset is considered **overbought**. Conversely, when **RSI** drops below 30, it may be a signal to **buy**, as the asset is considered **oversold**.
**RSI** is a valuable tool for **crypto traders** looking to make informed decisions based on **market trends**. By understanding **RSI** and how to interpret its readings, **traders** can gain a better understanding of **market dynamics** and potentially improve their **trading** outcomes.
Exploring Bollinger Bands
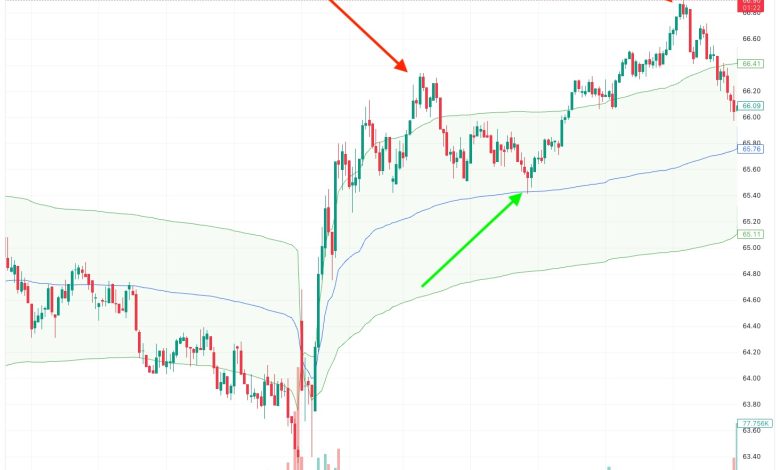
Bollinger Bands are a popular technical indicator used by many crypto traders to analyze price movements and identify potential trends. These bands consist of a simple moving average line in the middle, with two standard deviation lines plotted above and below. The width of the bands expands and contracts based on market volatility, providing traders with valuable insights into potential price breakouts or reversals.
One key concept to understand when exploring Bollinger Bands is the idea of “band squeezes.” This occurs when the bands contract tightly around the price action, indicating a period of low volatility. Traders often interpret this as a sign that a significant price movement may be imminent. When the bands expand after a squeeze, it can signal the start of a new trend or a strong breakout in either direction.
Another important aspect of Bollinger Bands is the concept of “band riding.” This strategy involves buying when the price touches the lower band and selling when it touches the upper band. Traders use this approach to capitalize on short-term price fluctuations within the bands. However, it’s essential to combine this strategy with other technical indicators or analysis methods to confirm potential trading signals.
In addition to band squeezes and band riding, traders can also use Bollinger Bands to identify overbought or oversold conditions in the market. When the price touches or exceeds the upper band, it may indicate that the asset is overbought and due for a correction. Conversely, when the price touches or falls below the lower band, it could suggest that the asset is oversold and potentially undervalued.
Overall, Bollinger Bands are a versatile tool that can help crypto traders make more informed decisions in the market. By understanding how to interpret band squeezes, band riding, and overbought/oversold conditions, traders can gain a better understanding of price movements and potential trading opportunities. It’s essential to combine Bollinger Bands with other technical indicators and analysis methods to develop a comprehensive trading strategy.
The Importance of MACD in Crypto Trading
The Moving Average Convergence Divergence (MACD) is a crucial technical indicator that every crypto trader should be familiar with. It is used to identify changes in the strength, direction, momentum, and duration of a trend in cryptocurrency prices. By analyzing the relationship between two moving averages of an asset’s price, the MACD provides valuable insights into potential buy or sell signals.
One of the key benefits of using the MACD in crypto trading is its ability to generate early signals of trend reversals, allowing traders to capitalize on market opportunities before they fully materialize. This can help traders make more informed decisions and improve their overall profitability in the volatile crypto market.
Additionally, the MACD can be used in conjunction with other technical indicators to confirm trading signals and filter out false alarms. By combining the MACD with tools like the Relative Strength Index (RSI) or Bollinger Bands, traders can enhance the accuracy of their trading strategies and reduce the risk of making costly mistakes.
Overall, understanding the importance of the MACD in crypto trading can give traders a competitive edge in the market. By incorporating this powerful indicator into their analysis, traders can gain a deeper understanding of market trends and make more informed decisions that can lead to greater success in their trading endeavors.
Using Fibonacci Retracement Levels
One of the most popular technical indicators used by crypto traders is the Fibonacci retracement levels. These levels are based on the Fibonacci sequence, a mathematical pattern that is found in nature and often used in trading to identify potential support and resistance levels.
To use Fibonacci retracement levels, a trader must first identify a significant price movement, known as a swing high and swing low. The Fibonacci retracement levels are then drawn between these two points, with the most common levels being 23.6%, 38.2%, 50%, 61.8%, and 78.6%. These levels can help traders determine potential areas of price reversal or continuation.
Traders often use Fibonacci retracement levels in conjunction with other technical indicators to confirm their trading decisions. By combining Fibonacci retracement levels with other tools such as moving averages or trend lines, traders can increase their chances of making successful trades.
Mastering the Stochastic Oscillator
The Stochastic Oscillator is a popular technical indicator used by crypto traders to identify overbought and oversold conditions in the market. This indicator compares the closing price of a cryptocurrency to its price range over a specific period of time, typically 14 days. By analyzing the Stochastic Oscillator, traders can determine when an asset may be due for a reversal in price direction.
One of the key concepts to understand when mastering the Stochastic Oscillator is the idea of %K and %D lines. The %K line represents the current price position relative to the price range, while the %D line is a moving average of the %K line. When the %K line crosses above the %D line, it is considered a bullish signal, indicating potential buying opportunities. Conversely, when the %K line crosses below the %D line, it is seen as a bearish signal, suggesting potential selling opportunities.
Another important aspect of using the Stochastic Oscillator is the concept of divergence. Divergence occurs when the price of a cryptocurrency is moving in the opposite direction of the Stochastic Oscillator. This can signal a potential trend reversal, as it indicates that the momentum of the price movement is weakening. Traders can use divergence as a confirmation signal when making trading decisions.
In conclusion, mastering the Stochastic Oscillator can be a valuable tool for crypto traders looking to analyze market conditions and make informed trading decisions. By understanding how to interpret the %K and %D lines, as well as recognizing divergence patterns, traders can gain a better understanding of market dynamics and improve their trading strategies.